
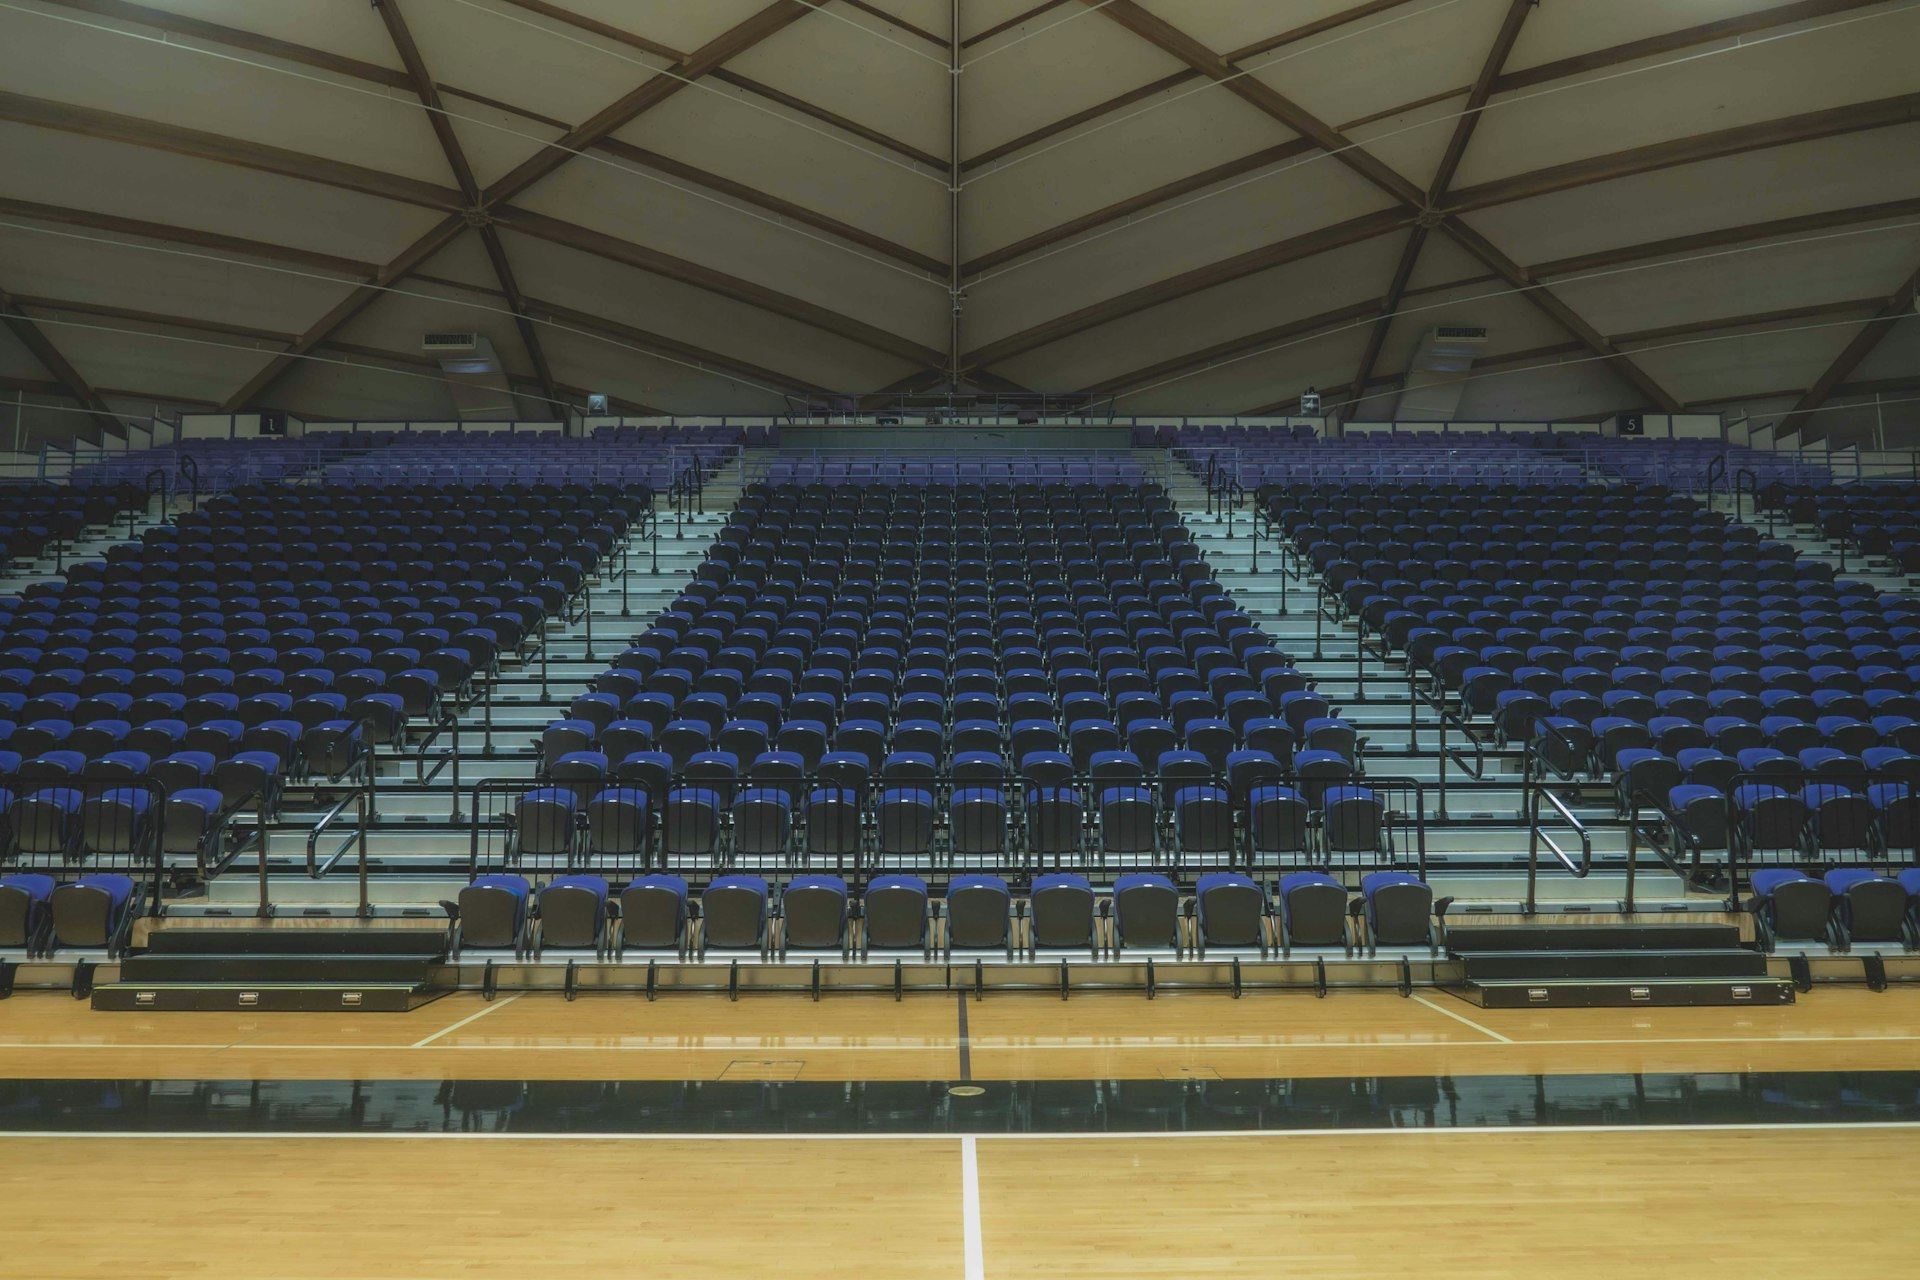

Ninety days before opening night, the live-events arena passed its final forecast checkpoint. The integrated schedule, cost and risk view that the KonradBeck controls team maintains for the owner shows the critical path holding to the date printed on the tickets, with float measured in days and every remaining risk tied to an owner and a response.
Why a 90-day checkpoint
On a $620 million arena with a sold-out first event, the last quarter of the job is where float goes to die. Finishes, seating, the rigging grid, life-safety testing and the certificate of occupancy all stack onto the same weeks. The owner asked for a formal checkpoint at 90 days out: one forecast everyone signs up to, and an honest list of what could still move it.
The checkpoint was not a status meeting. It was a test of the forecast. Our team ran a full schedule health check, refreshed the Monte Carlo QSRA with the latest risk register and reconciled the cost forecast against committed and pending changes before anyone saw the result.
What the forecast shows
- Critical path. The path now runs through life-safety system testing and the inspections that lead to occupancy, not through finishes. That is where the attention is going.
- Float. Total float on the critical path is positive and has been stable for three straight updates. Near-critical paths through seating install and the center-hung display are tracked weekly.
- Cost. The estimate at completion sits inside the approved budget, with contingency drawdown tracking below the curve set at baseline.
- Risk. The QSRA puts opening night above the P80 confidence level. The top three remaining risks each have a named owner and a dated response.
When the date is on a ticket, the schedule stops being a plan and becomes a promise. Our job is to tell the owner, every week, whether the promise is still true.
Project controls director, KonradBeck
How the team got here
The controls team was embedded from early in construction. The baseline was built backwards from opening night and every contractor update was reviewed against it before it was accepted. Changes were priced and logged within days, not months, so the cost forecast never had a hidden backlog behind it. When the forecast showed float eroding on the roof sequence during the first winter, the owner had the time impact analysis in hand while there was still room to resequence.
What comes next
From here the team moves to a weekly forecast and a daily look-ahead on the occupancy path. The monthly executive report becomes a weekly one-page brief for the owner's leadership. The goal for the next 90 days is simple: no surprises, only decisions.