Dashboards leaders actually read.
Controls systems, data pipelines and executive reporting that pull schedule, cost and risk into one trusted source, so leaders see the truth in minutes instead of chasing spreadsheets.
Why it matters.
Data lives in too many places
Schedules in P6, costs in accounting, risks in a spreadsheet and changes in email. Every report becomes a manual reconciliation exercise.
Manual reporting is slow and fragile
When reports take two weeks to assemble, decisions are made on old data. One broken formula can mislead an entire board.
More data is not more clarity
Dashboards packed with charts and no conclusions get ignored. Leaders need trends, exceptions and a clear signal.
How we work.

- 01
Controls systems setup
Primavera P6, cost systems and risk tools configured with coding and structures that let them talk to each other.
- 02
Single source of truth
Schedule, cost, change and risk data brought together on one data date, with clear ownership of every field.
- 03
Power BI dashboards
Executive and project dashboards built around decisions, showing trends, exceptions and forecasts rather than raw data.
- 04
Automated reporting
Repeatable data pipelines that cut report preparation from days to hours and remove copy-and-paste errors.
- 05
Forecasting analytics
Trend-based and AI-assisted forecasting that tests the official forecast against what performance data says is likely.
What you receive.
Every engagement is scoped to the project. These are the core outputs clients can expect.
Coding, structures and data definitions shared across all controls tools.
Forecast finish, EAC, change exposure and top risks on one screen.
Detailed views for project teams, linked to the executive summary.
A report pack that refreshes from source data every period.
Guides and sessions so your staff can run and extend the system.
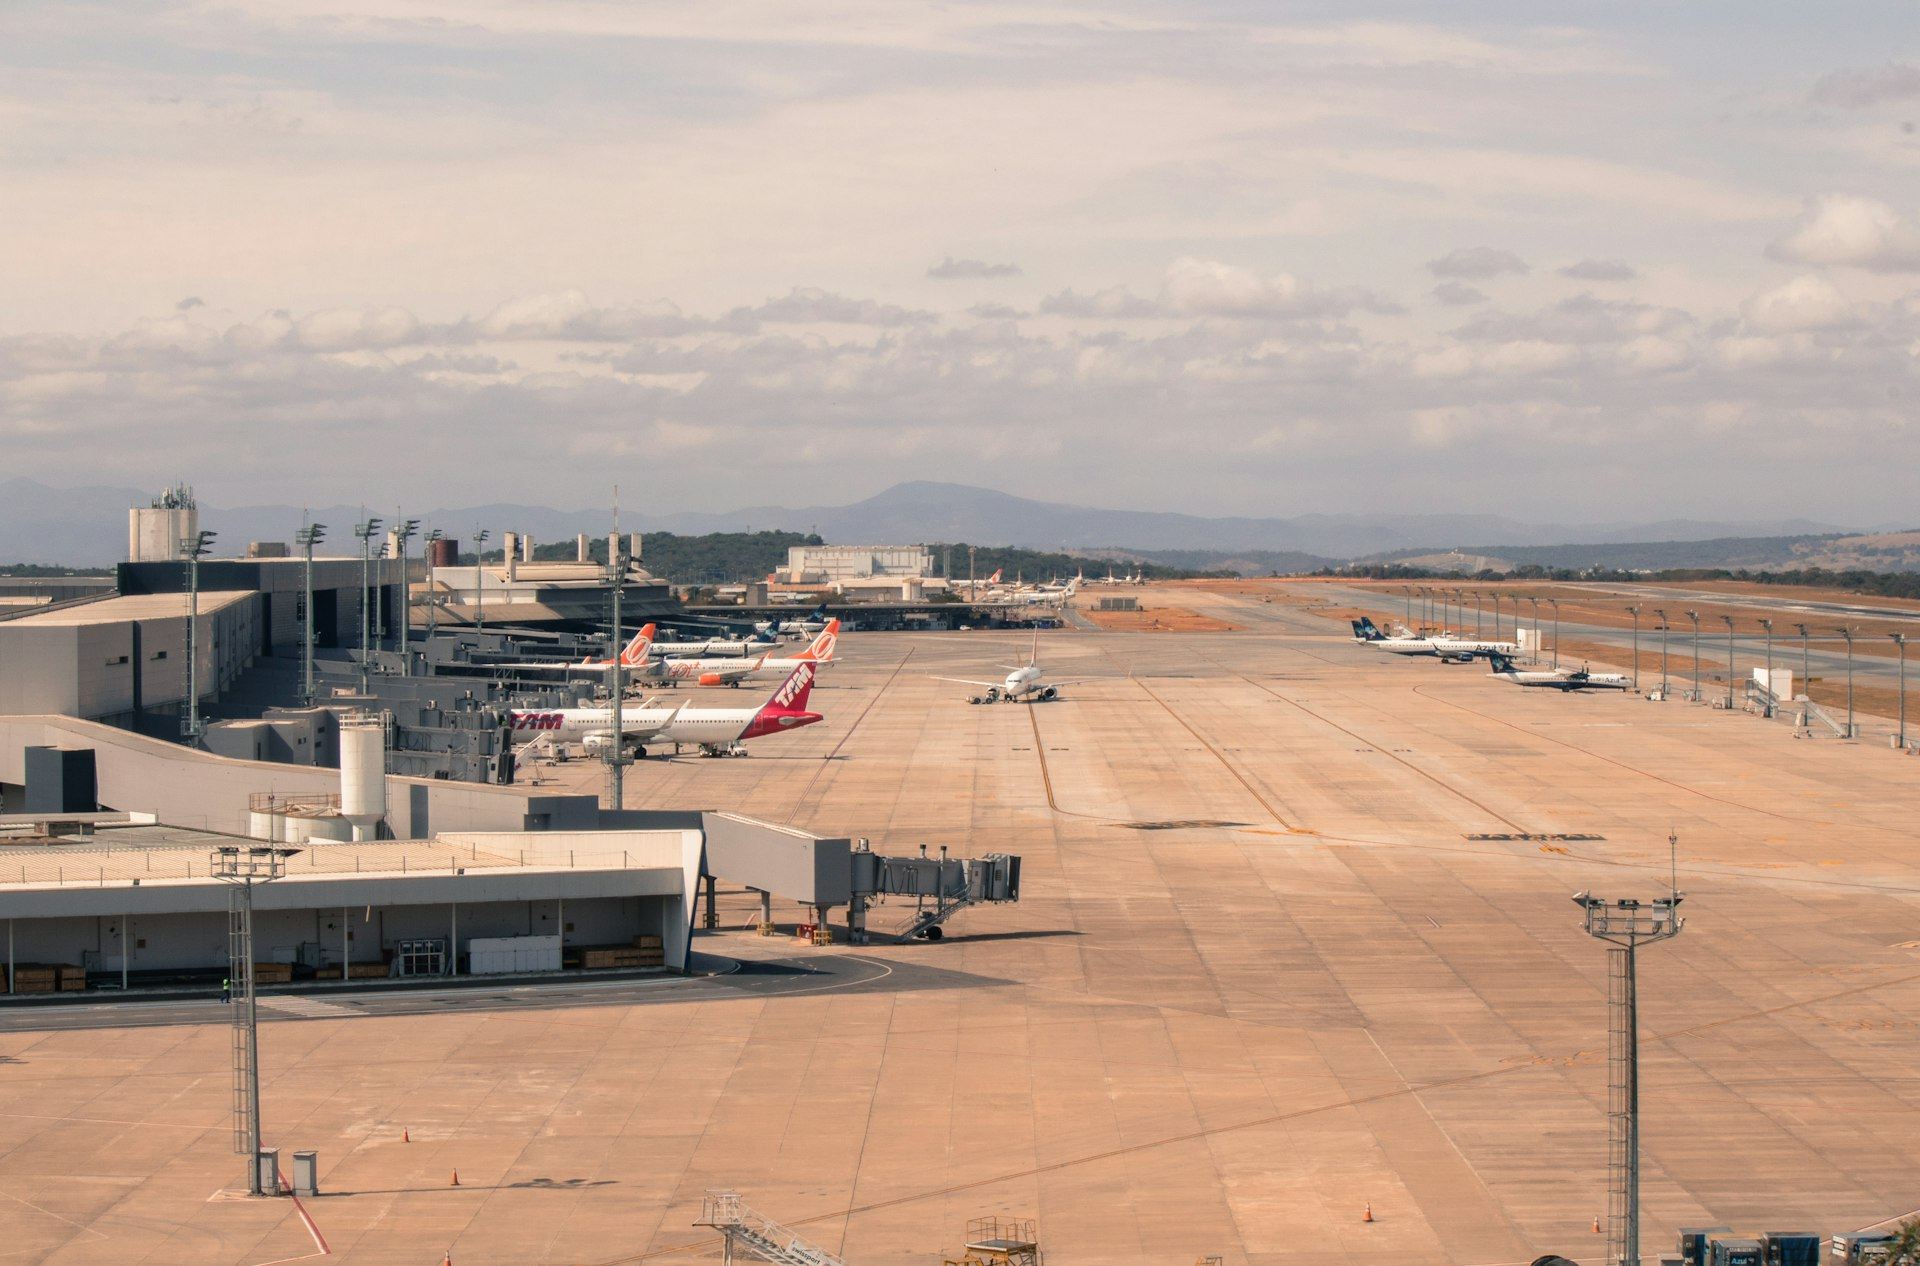
One screen for a live airport.
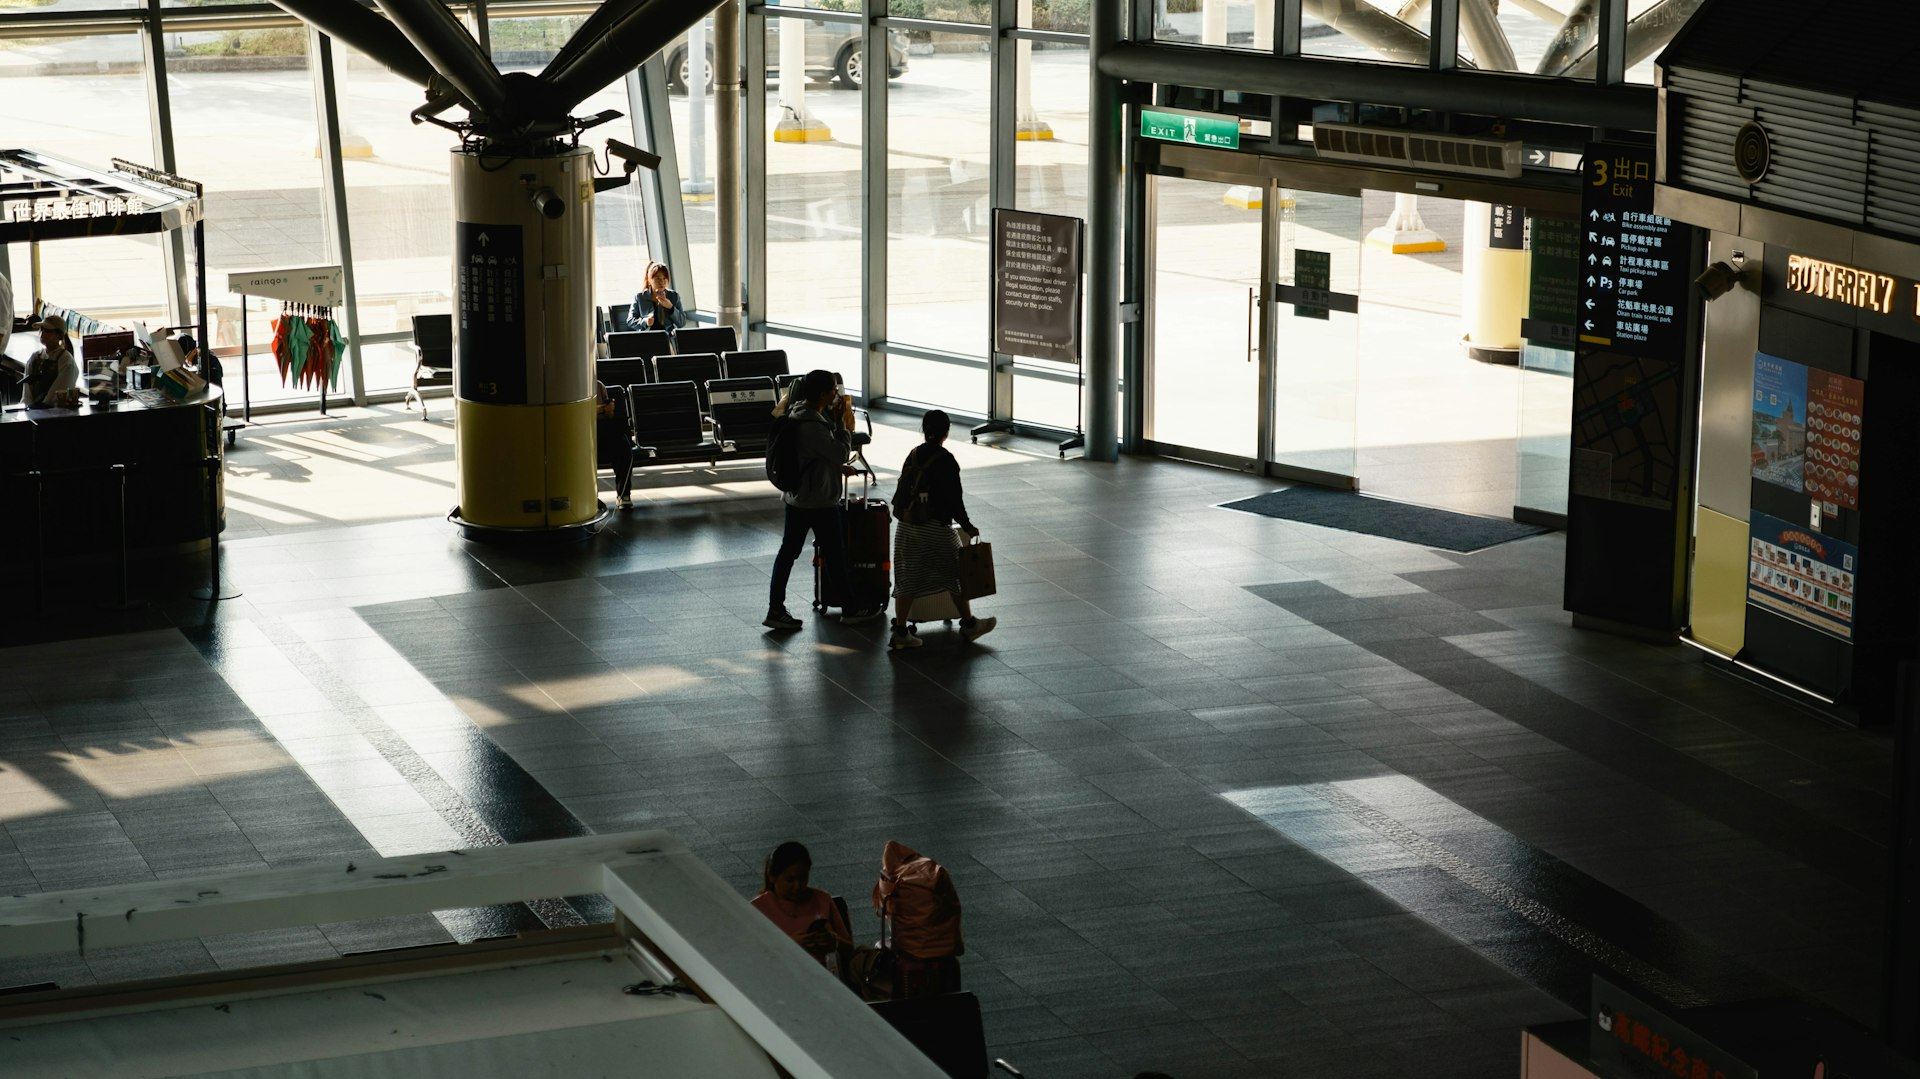
The airport operations and baggage program ran inside an active airport. We connected schedule, cost and risk data into one reporting model and built dashboards that showed airport leadership the forecast, the exceptions and every operational cutover at a glance, all delivered without a missed departure.
- $310M
- Program controlled
- 1
- Source of truth for all reporting
- 0
- Departures missed
Questions clients ask us.
Do we need to buy new software?
Usually not. We start with the platforms you already own, such as Primavera P6, your cost system and Power BI, and connect them properly.
Are you tied to any software vendor?
No. We are independent. We recommend tools based on your needs and work with what fits your organization.
How long does a dashboard take to build?
A first working executive view can often be in place within weeks. We refine it with your leaders over the following reporting cycles.
Can our team maintain the system after you leave?
Yes. We document everything and train your staff, so the reporting keeps running without us.

Turn complexity into clarity.
Tell us what is keeping the project up at night. We will tell you where the schedule, cost and risk really stand.