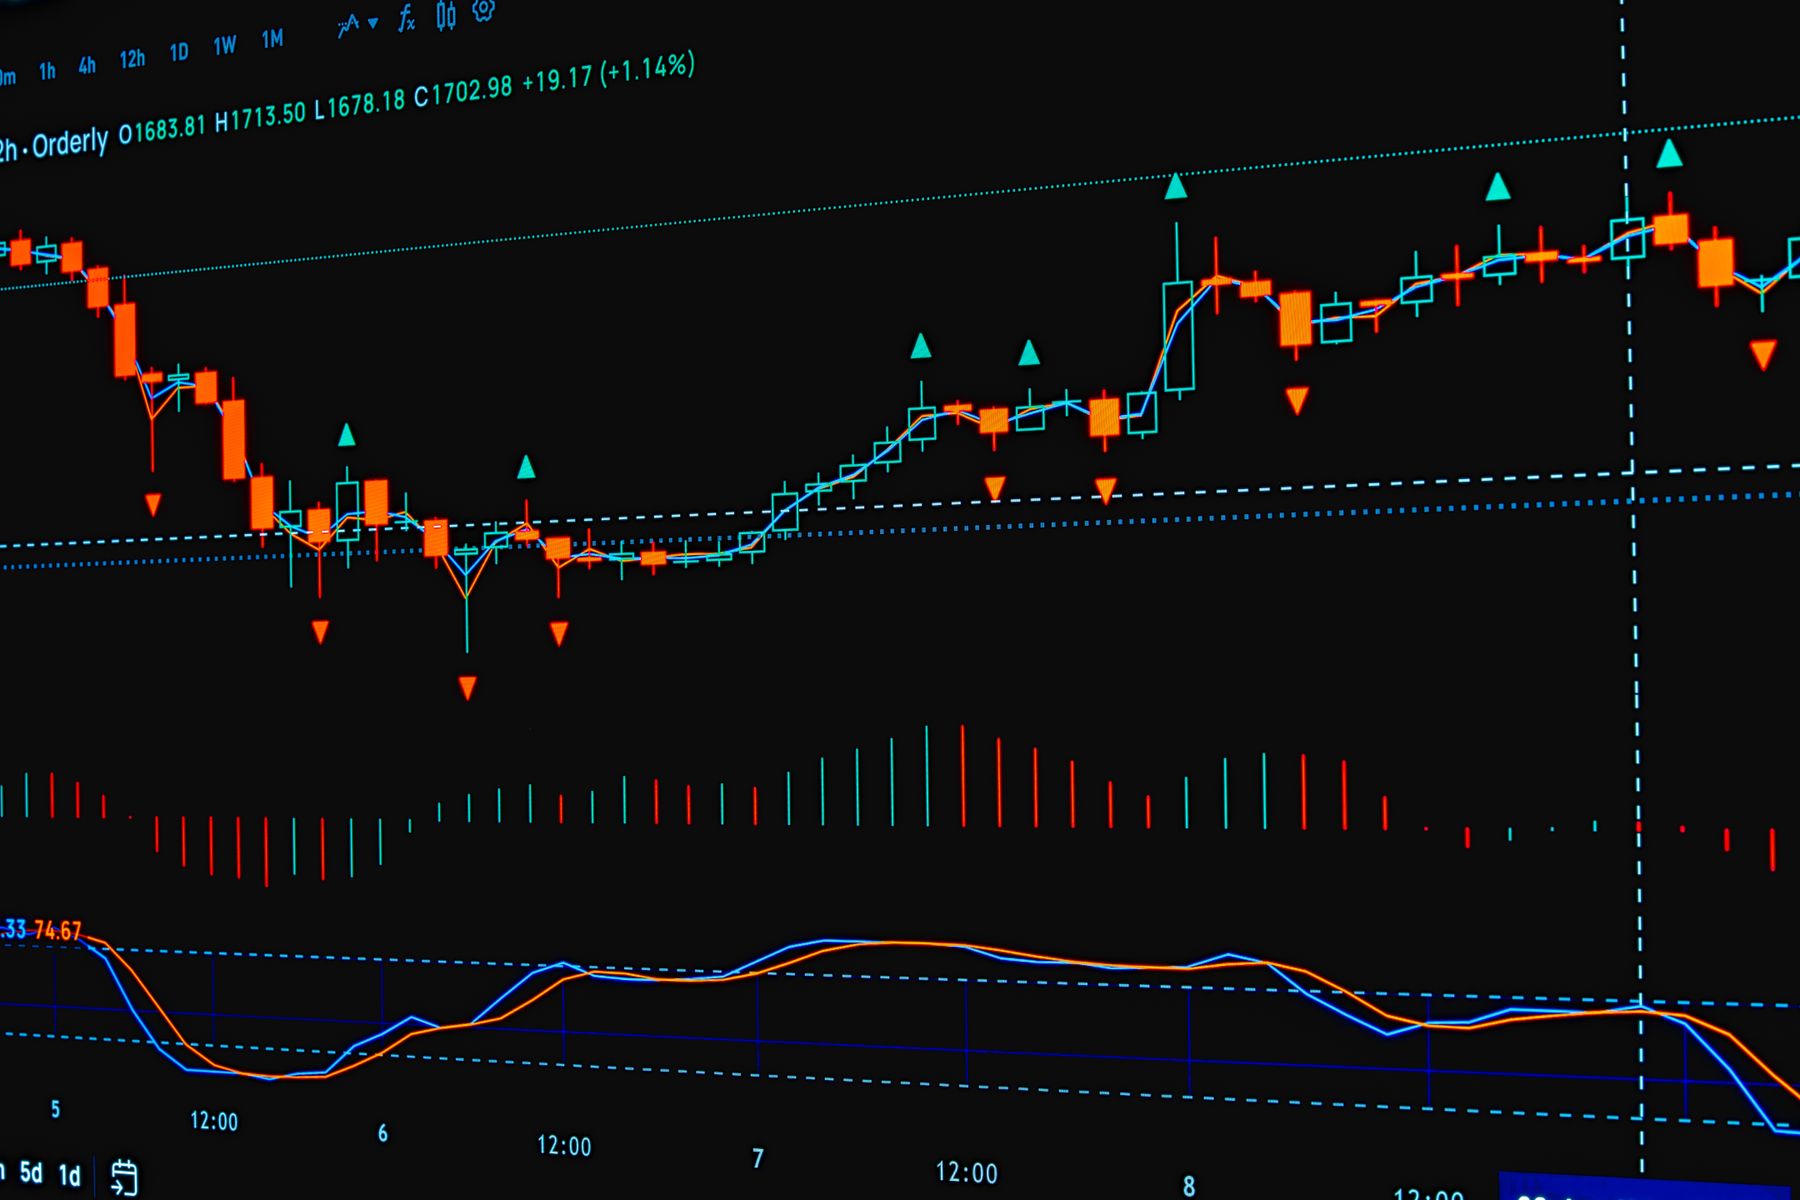


KonradBeck has launched executive controls dashboards, a reporting offering for leadership teams that need one honest view of their program every period. Each dashboard pulls schedule, cost, change and risk data into a single page built in Power BI, and every number on it is checked by a KonradBeck analyst before leadership sees it.
The problem with most reports
Executives on capital programs are often buried in reporting and still short on answers. A 60-page monthly report arrives two weeks after the data date. The schedule says one thing and the cost report another. The risk register lives in a separate file nobody opens. Leaders end up making decisions on the summary slide, and the summary slide is usually the least checked page in the deck.
Leaders do not need more data. They need fewer numbers they can trust, and they need them while there is still time to act.
Yusuf Balogun, Founder & CEO, KonradBeck
What the dashboards show
- Time. Key milestones against baseline, critical path changes, float erosion and P50 and P80 dates where a QSRA is in place.
- Cost. Budget, committed cost, estimate at completion, CPI and SPI where earned value is in place, and a cash flow curve against plan.
- Change. The change order log summarized by status, cause and value, with aging so nothing sits unpriced for months.
- Risk. Top risks with owners and responses, and contingency drawdown against the risks retired.
- Portfolio view. For program owners, the same measures rolled up across projects, so leaders can see which project needs attention first.
Checked before it is shown
A dashboard is only as good as the data behind it. Every period, a KonradBeck analyst runs a schedule health check, reconciles the cost data and confirms that changes and risks are current before the dashboard refreshes. Where the data has a problem, the dashboard says so, instead of hiding it behind a green light.
How to get started
Executive dashboards are available as a standalone offering or as part of an integrated project controls engagement. Most start with a short data review of your existing Primavera P6 or Microsoft Project schedules and cost systems, followed by a first dashboard within a few reporting periods. Start a conversation with our controls technology team to see what one honest page could tell your leadership.